

Did you know there are over 150 different community indicators on Grant County Trends - each updated throughout the year? But which ones, and when?
This issue of the Grant County Trends Blog lists the most recently updated indicators on the Grant County Trends website.
This page will be updated and email alerts sent on a quarterly basis. Don't miss an update - subscribe today!
Recent Updates
In PEOPLE: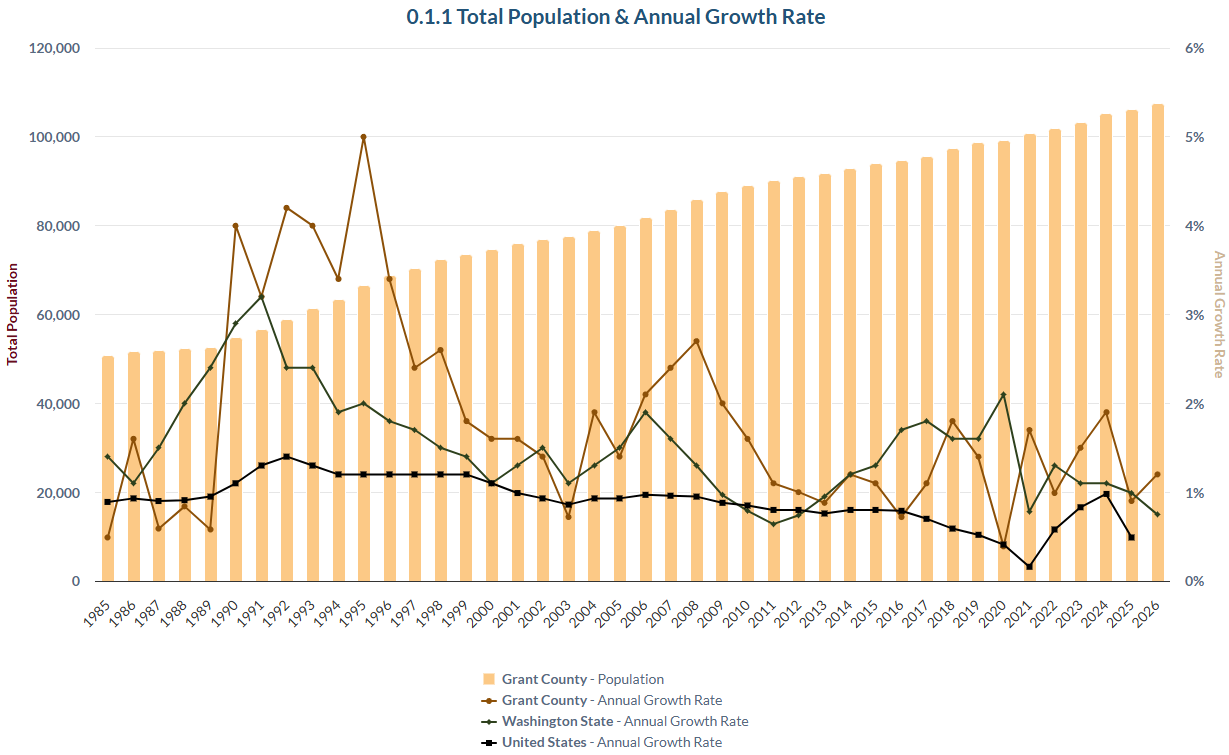
The county’s population growth pace quickened over the year ending in March 2026, rising to an estimated 107,500. That represented a 1.2% year-over-year increase, considerably higher than the pace of state population growth of 0.8%. The year-over-year county rate was a bit below the prior 10-year compounded rate of 1.3%. The recent county growth rate places Grant 4th in the state, after Franklin, Benton and Clark Counties.
Over the past 12 months, the city of Moses Lake grew at nearly twice the pace of the county. The growth, however, was well below its prior 10-year compounded annual rate of 2.4%.
In AGRICULTURE: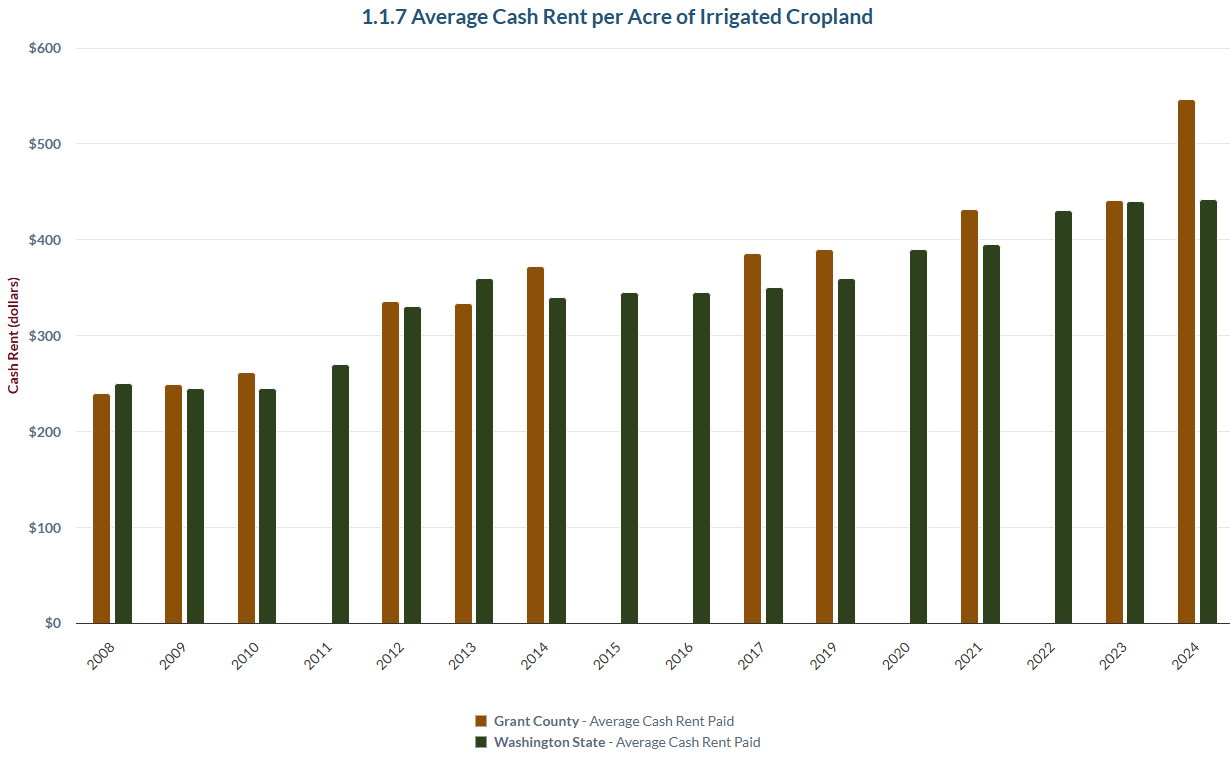
The county’s average cash rent of irrigated farmland jumped in 2024.
Irrigated farmland commands much higher valuations, and hence rents, than dryland agriculture. Unlike many counties in eastern Washington, the majority of Grant County’s farmland, nearly three quarters of it, is irrigated. Consequently, cash rents reveal much about the robustness of the farm economy in the county.
In 2024, the latest year for which data is available, average cash rent for irrigated farmland was $546 per acre. That is well above the values of the two prior years of which registered $432-$441 per acre. It is also well above the state average that year of $442 per acre for that year.
In ECONOMIC VITALITY: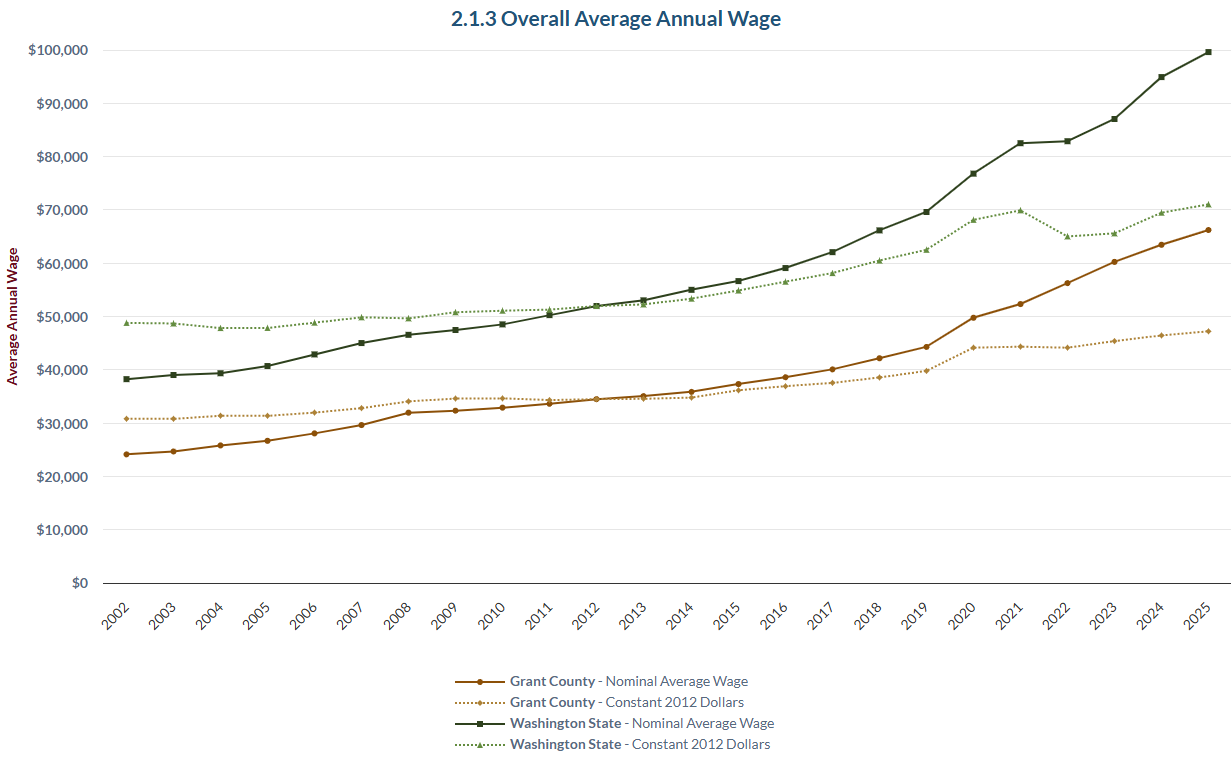
Grant County’s overall average annual wage increased in 2024 but is still below the state rate.
In most communities, earnings from work form the largest component of personal income, greater than the other two components: investment returns and federal transfer payments. Average earnings from work at all jobs in a community reflect, to some degree, hours worked. But they more importantly reflect the mix of industries, including government, in the local economy. And their year-to-year change mirrors the dynamics of supply and demand in the local labor market. Included in this average are all workers who paid into the unemployment insurance fund; most sole proprietors are not a part of the mix.
The overall average wage in Grant County reached $66,225 in 2025. This was about $22,000 higher than in pre-pandemic 2019. Inflation took away much of the wage gains, but as the graph reveals, “real” gains since 2019 were still about $7,500 per year.
The Washington state average annual wage in 2025 nearly reached six digits, at $99,611. That represented a 4.9% increase, slightly higher than the 4.4% realized in Grant County. 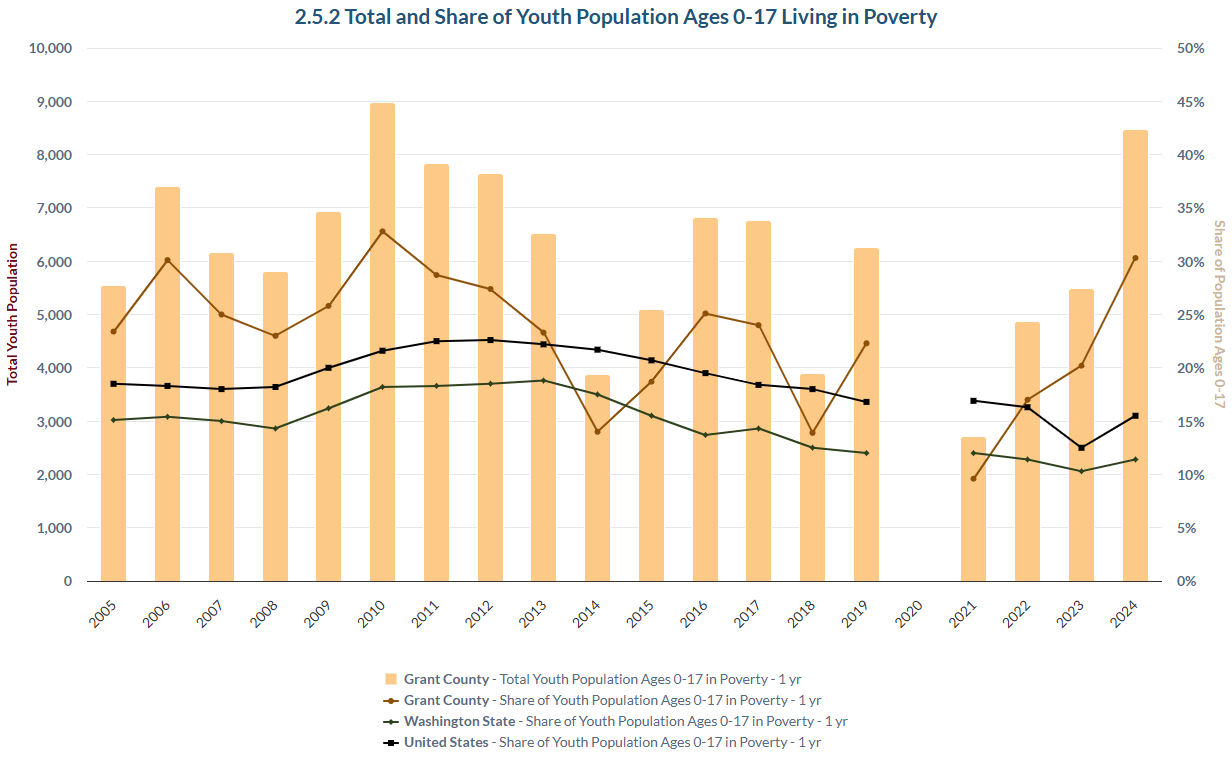
Youth poverty in the county has recently surged.
Children living in families whose income are below the poverty threshold are counted as “in poverty.” Poverty thresholds vary by family size and increase every year by the consumer price index. They do not vary by location. For a family of four in 2024, the poverty threshold was $31,200. Should two children be in a family whose income is at or below this level, both are said to be in poverty.
For 2024, Census estimates that nearly 8,500 Grant County children lived in poverty. This represents a huge jump from the prior year and the second highest estimate on record. It also represents the second highest rate on record, at 30%. For most years of the past decade, the rate in the county has been above that of the U.S.
In EDUCATION: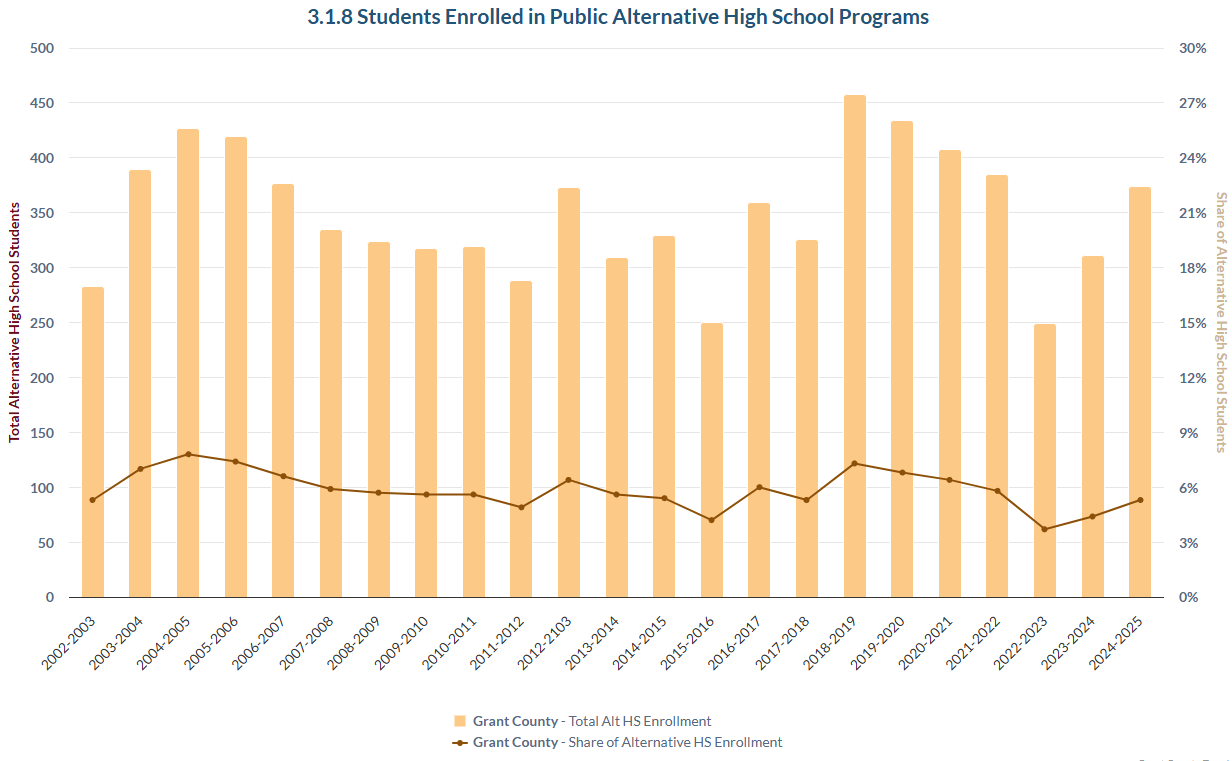
The number of Grant County students enrolled in public alternative high school programs recently climbed but is still in a long-term decline.
Many families prefer to enroll their children in alternatives to the mainline public high school. In the realm of public schools, these may be technical schools or those serving at-risk students with novel curriculum delivery programs. There are several such schools among the school districts in Grant County.
In school year 2024-2025, 374 county students received their high school education in this manner. This represents a jump over the two prior school years, but a number considerably below the peak seen in school year 2018-2019 of 458. The most recent results place the size of this student group at about 5% of all public high school students in the county.
In ENVIRONMENT: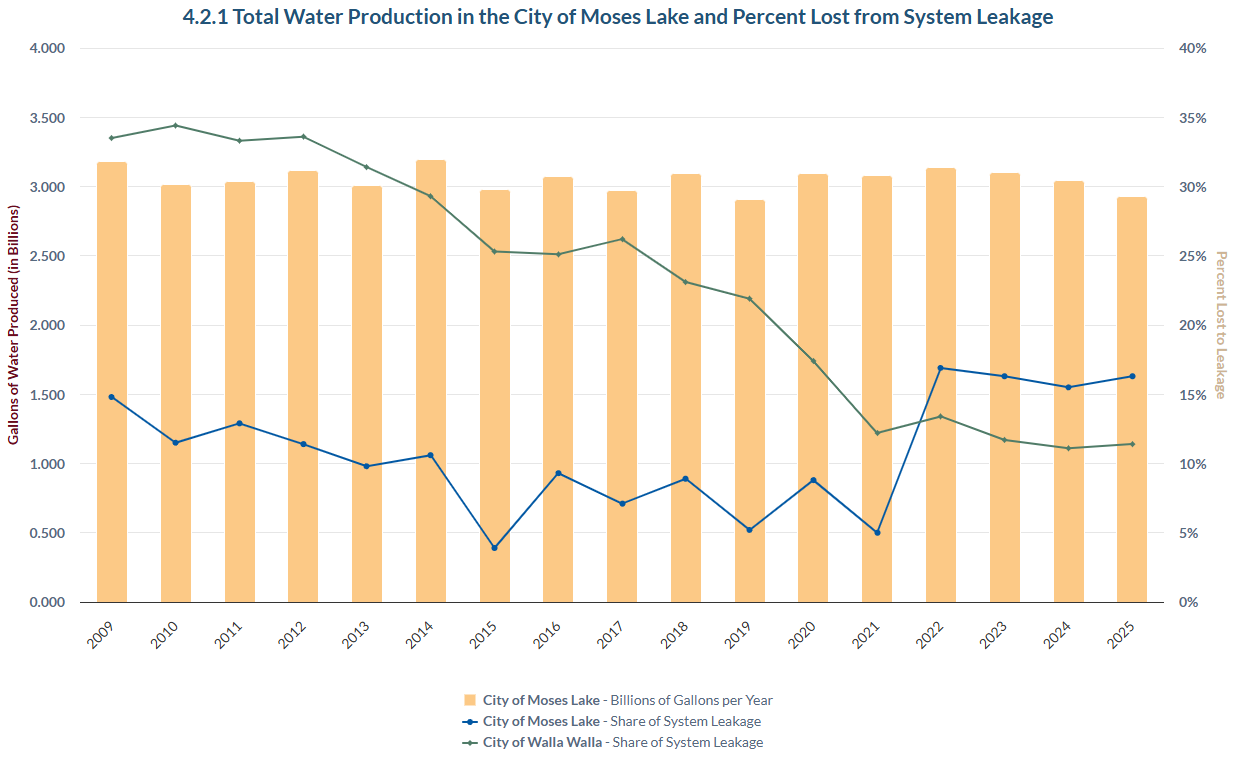 Water production in the city of Moses Lake is declining; the system loss, however, has stayed the same for the past few years.
Recognition that water is a very precious resource is growing here, throughout central Washington, and for that matter, throughout the country. Monitoring its use gives an idea of how well water management policies and practices are working to reduce the rate of growth, or even total use.
The latter scenario applies to the city of Moses Lake. Despite a growing population, water production in the city has slowly drifted down since the most recent peak in 2022. Then, 3.1 billion gallons were pumped through the system; most recently (2025), the annual amount fell to 2.9 billion. Clearly, the city has become more efficient in its water consumption.
Yet, opportunity for improvement remains. The share of water pumped that is then “lost” throughout the system was about one out of every six gallons in 2025. This share has changed little in the past four years.
In HEALTH: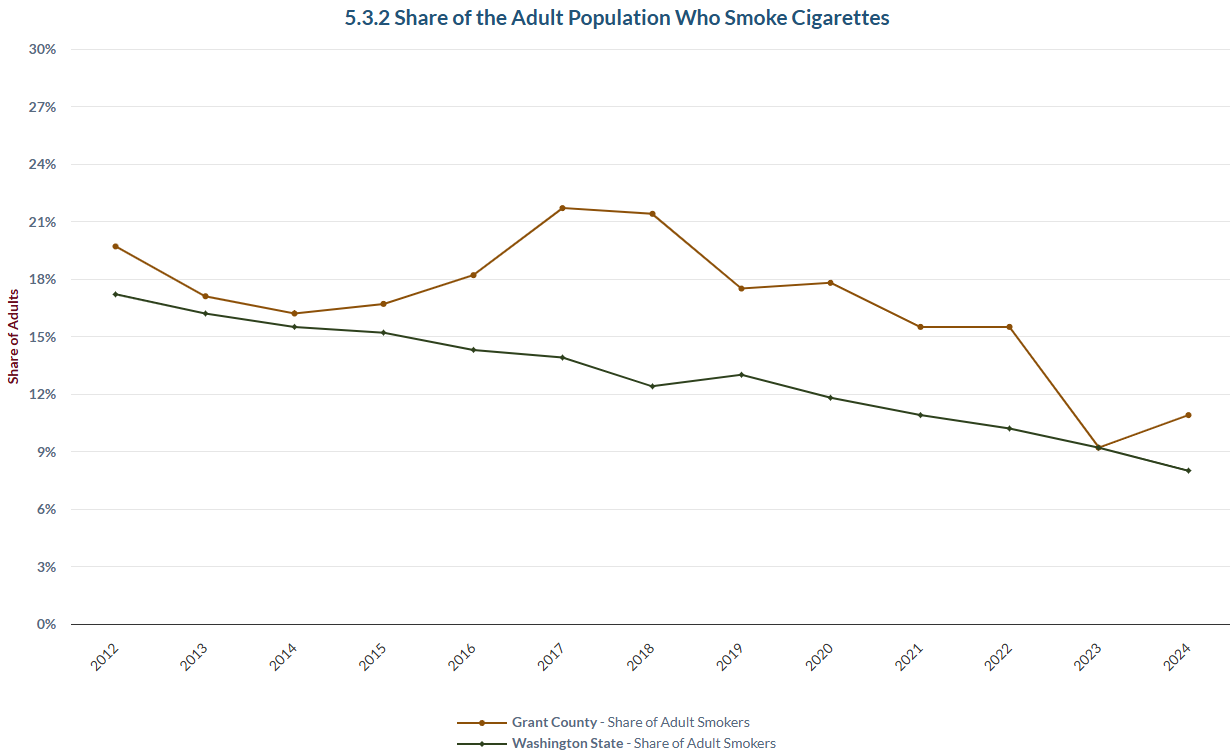
The share of the county’s adult population who smoke cigarettes continues to drop.
The perils of smoking are well known, and for decades the federal government has issued warnings in a variety of ways. In 2005, Washington state reinforced those policies by enacting legislation that forbids smoking in indoor public spaces. Policies and general knowledge have led to steep declines of smokers across the country, and coupled Washington law, across the state.
This indicator, based on estimates from the Centers for Disease Control, tracks the share of adults in the county who still smoke, and compares to the state. For 2024, the most recent year of available estimates, about 11% of county adults said they smoke. This is nearly half the value of 2012. Nonetheless, the rate is about three percentage points above the state average. This gap is generally an improvement over the prior decade. 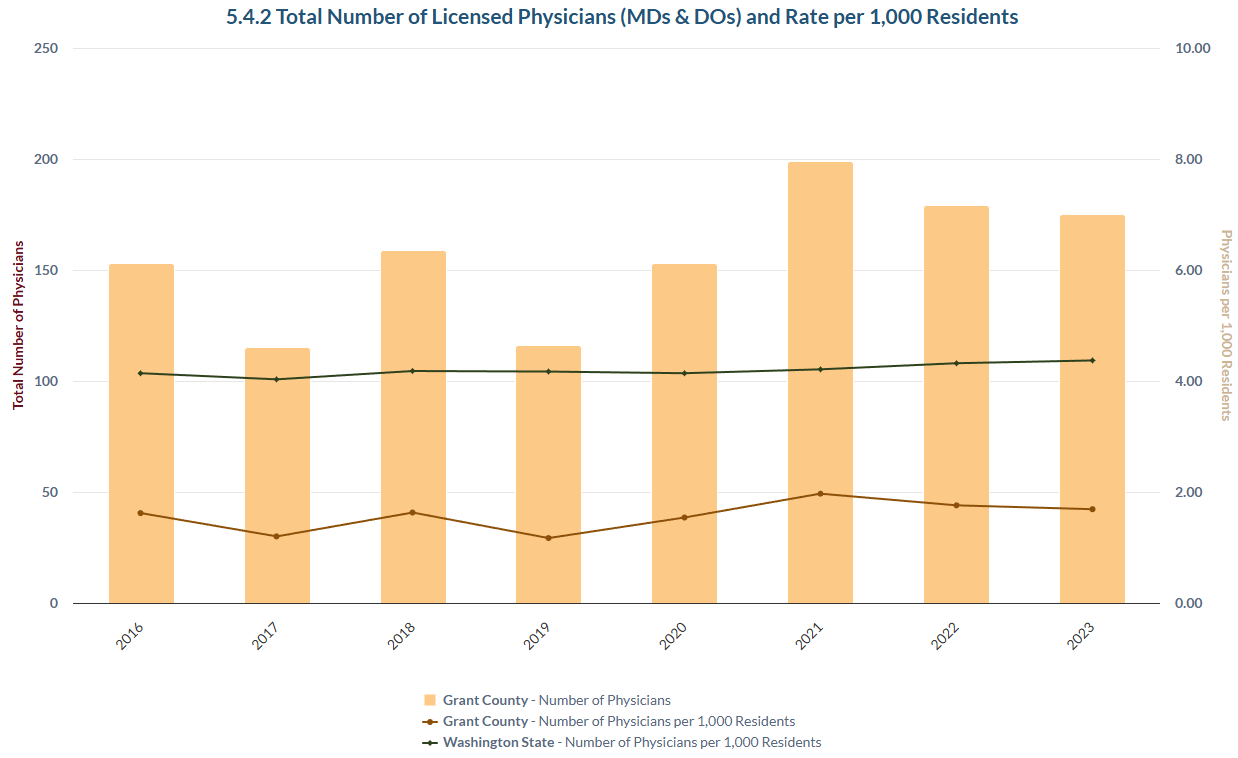
The number of licensed physicians has fallen but remains above several prior years.
Achieving favorable health outcomes in a population depends on many factors, some of which are not medical. Yet, the availability of clinicians is one of the determinants of health outcomes. This indicator tracks the number of licensed professionals with the state of Washington of one of the key provider types, physicians, MDs or DOs. (Nursing counts by county are not available.)
In 2023, the most recent year with published state licensure data, 175 physicians were present in Grant County. This represents a rather steep decline from 2021, when the count stood at 199. Nonetheless, the most recent count is still considerably above most of the prior years where the count was available. That said, the availability of physicians in the county is much lower here than statewide. In 2023, the rate per 1,000 residents in Grant County was 1.7 versus 4.4 statewide.
In HOUSING: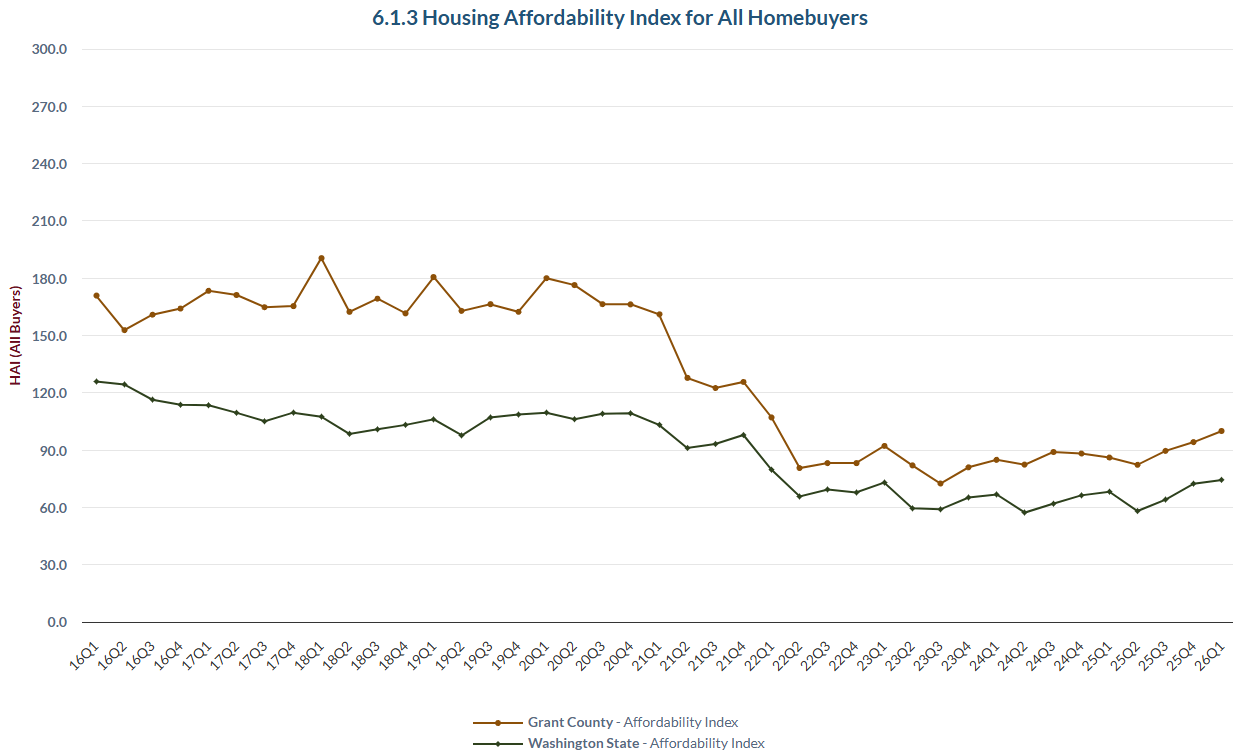
The housing affordability index for all Grant County homebuyers returns to 100.
Prices give an important signal of the state of the housing market. Affordability calculations, however, give a much more complete picture. Essentially a ratio of income available to spend on housing over current mortgage costs, an affordability index supplements a reading of the housing market by considering buyers’ ability to pay. This measure, from the Washington Real Estate Research Center at the University of Washington, uses median household income, divided by the current mortgage rate implied by market rates for a 30-year period for a home priced at the median.
A value of 100 implies that a household is just enough income to spend 30% of it on such a mortgage. A value less than 100 indicates that the income is inadequate to stay at or below the 30% threshold. And a value greater than 100 says that the household has more than income to stay at or below the 30% threshold.
For the most recent period, Q1 of this year, the all-buyer index for Grant County reached exactly 100. This marks the first time since Q1 of 2022 that the index stood at 100 or higher. The current county reading is a third higher than the state index value.
In PUBLIC SAFETY: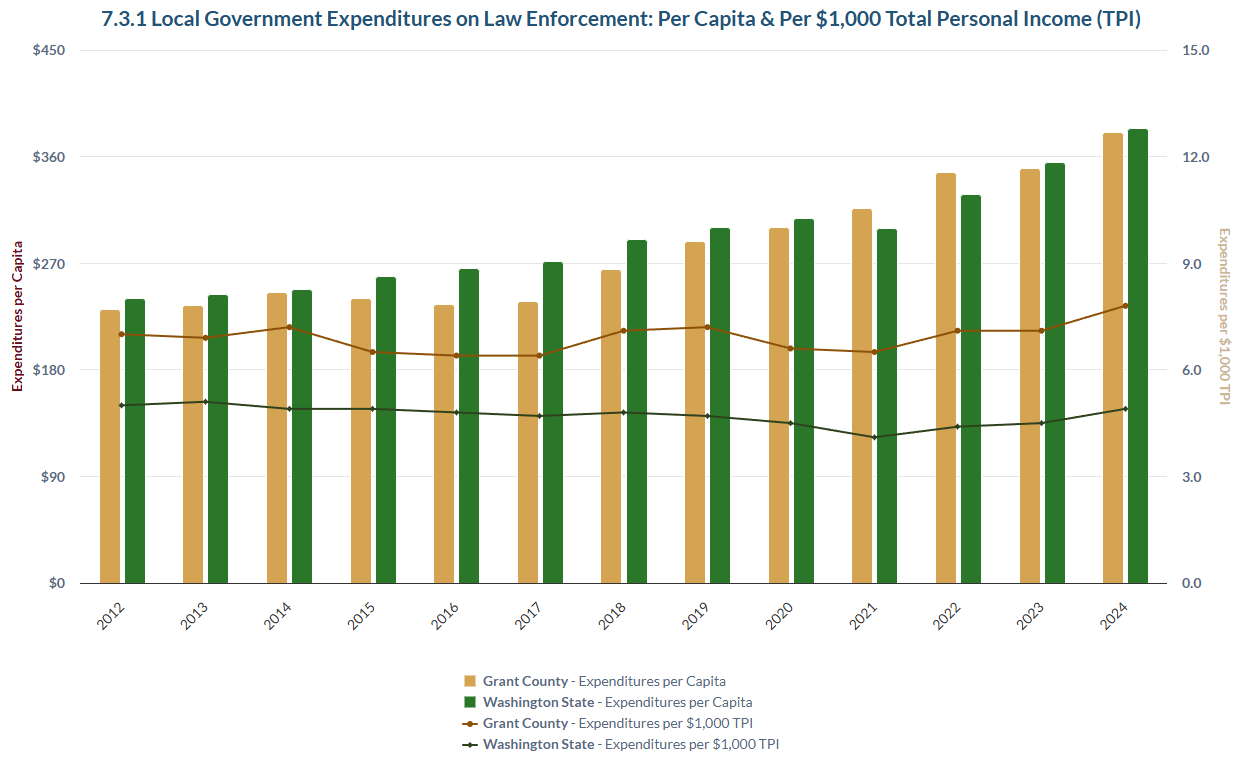
Local government expenditures on law enforcement are high in the County, by two measures.
Providing adequate public safety for all residents is one of the core functions of local government. Determining what is “adequate” is not easy, but one way is to compare local per capita counts of certified officers and compare to certain jurisdictions or state averages. Another is to consider the amount spent by local governments on law enforcement, either on a per capita basis or as a percentage of personal income. This indicator follows the latter approach.
In 2024, per capita expenditure of all jurisdictions in Grant County on law enforcement, including county government, stood at $380. This represents more than a 50% increase from a decade prior, when it was $240. Currently, the county’s per capita expenditure value is quite close to the state average of $384.
Since Grant County has lower per capita personal income than the state average, it is not surprising that law enforcement expenditures here as a fraction of total personal income are higher than the state. In 2024, nearly $0.8 out of $100 of the average resident’s income was spent on law enforcement. Statewide, that share was $0.5 per $100.
Values for this measure for the city of Moses Lake are much higher than the county average. For 2024, per capita expenditure surged to $463. And if residents of the city had the same per capita personal income as the county average, this implies a payment of $1.6 per $100 of personal income to city law enforcement activities.
To simplify the graph, click on the item(s) in the legend you would like to hide.
updated 7.23.26